Workload Reports for Agencies: How to Track Capacity and Stay Profitable (+ Free Template)
Workload reports made simple: Track capacity, billable hours, and team health in one guide. Includes free template!

William Nzewi
.avif)
Do you wonder what a workload report is or why it matters? Would you like to know how to create one?
In this article, I'll put these questions to bed. And I won't only show you how to create one, I'll also give you a free agency workload template you can use right away.
So if you're an ops manager, agency founder or team lead looking for a deep insight into team capacity tracking, read this guide to the end.
But first…

When people search for “workload reports,” most of what comes up is about HR departments tracking staff hours in big corporations. That’s not very helpful if you run a creative agency.
Why?
Because agencies work differently and there are several fast-moving pieces to keep an eye on. I'd bet you’re not just tracking headcount, shifts or vacation days.
As an agency owner, you have a lot more on your plate, handling client projects, deadlines and a team of people with different skills.
So what does a workload report mean for agencies?
A workload report shows you what your team is working on, how much time each person has left, and whether you have room to take on more projects.
It helps you answer these questions…
Before this starts sounding like capacity planning, let me quickly differentiate between the two…
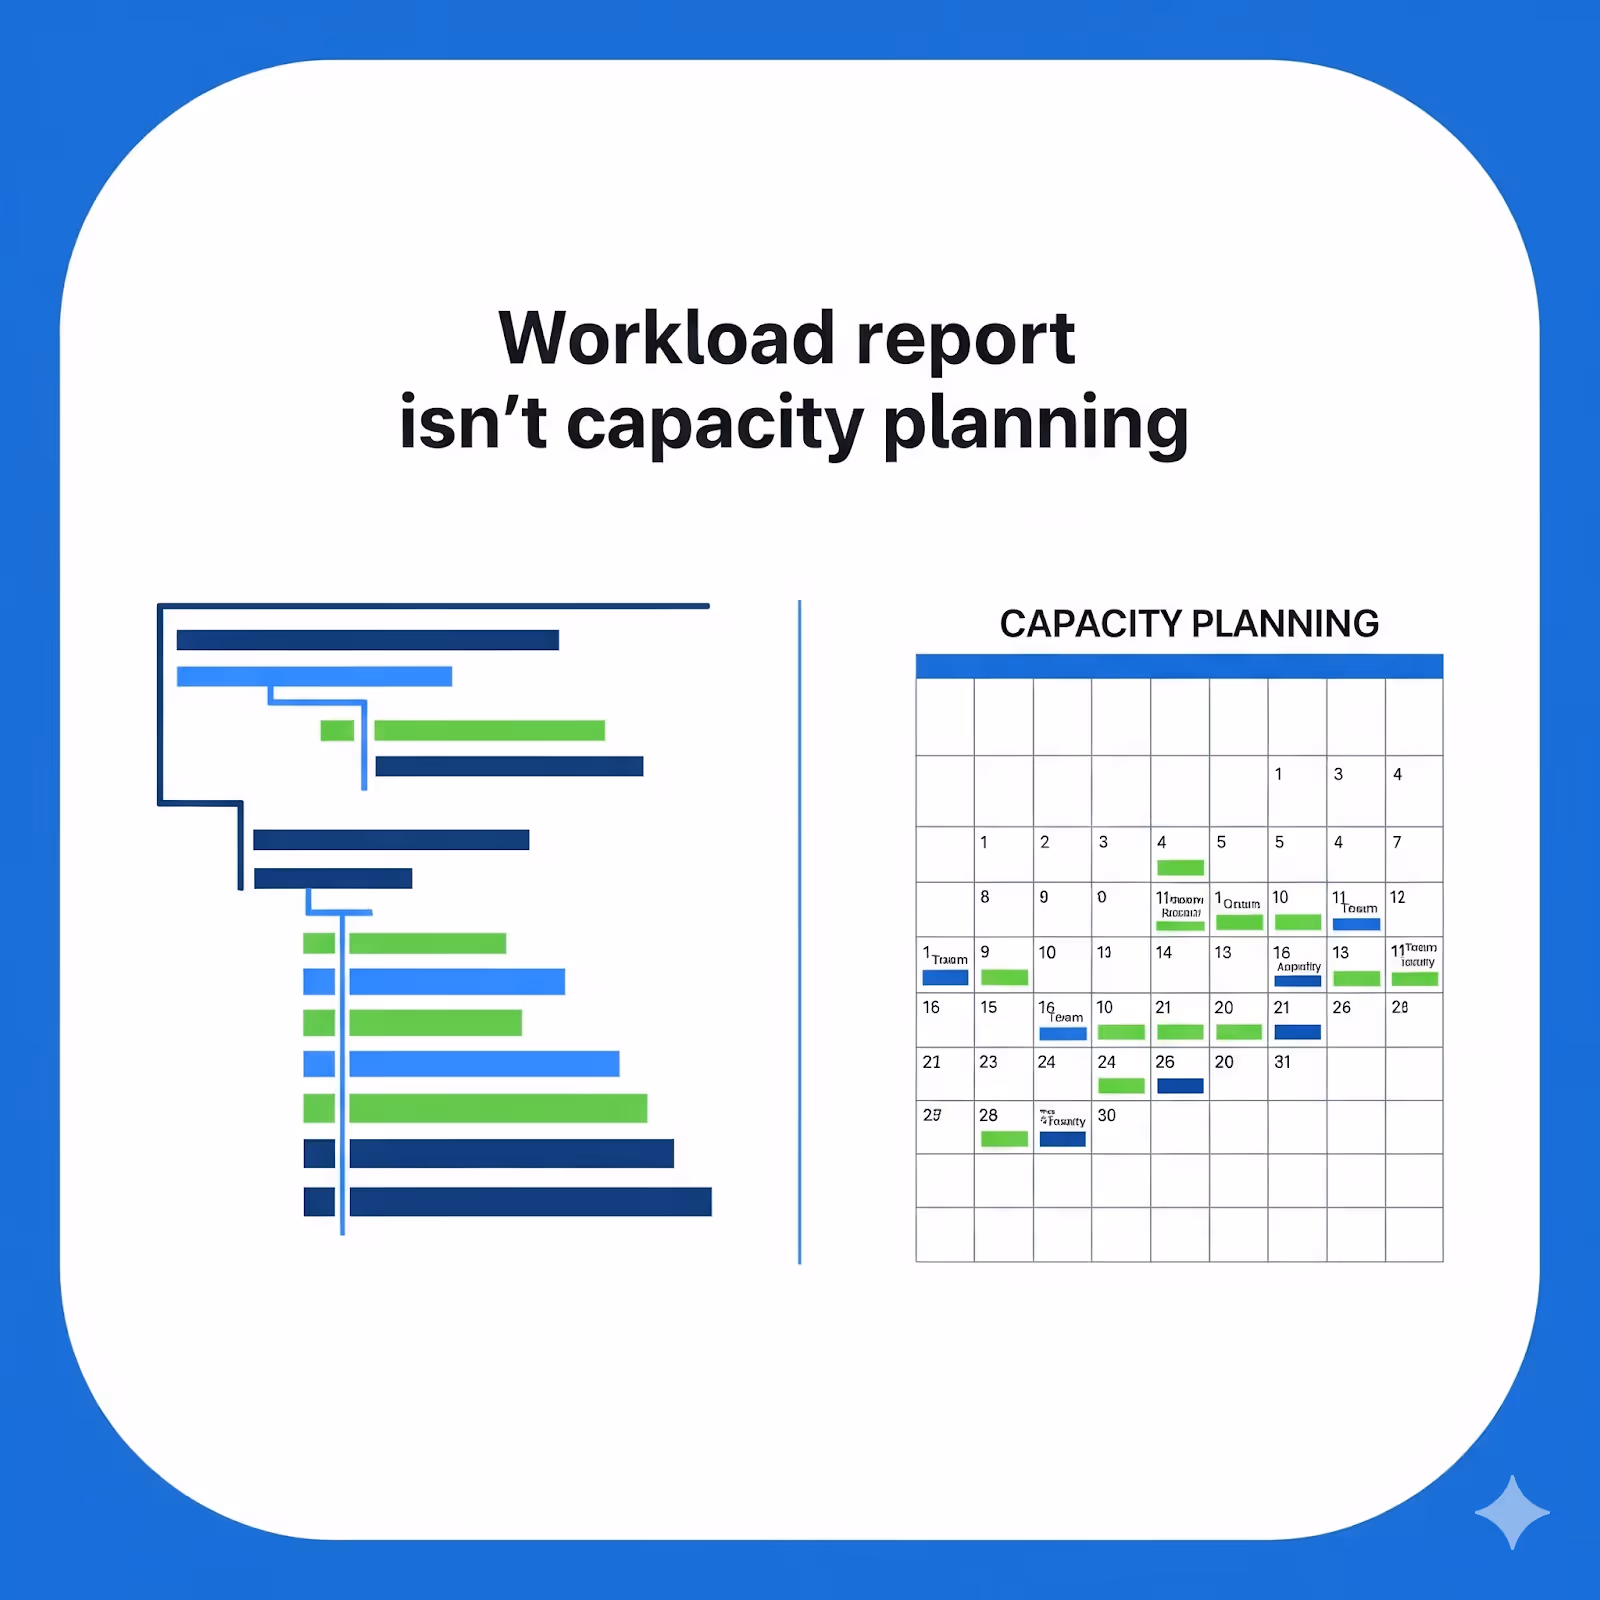
While capacity planning looks ahead to work out how much work a team can handle based on hours and skills, workload report checks (here and now) how much work a team is currently handling and where gaps or risks exist.
In other words, capacity planning lives in the future while workload report focuses on the present.
So which does your agency need?
Both actually.
While you plan for next quarter (even next year), you have to get today's (and this week's) job done. Else there'll be no next quarter.
So what are the key parts of an agency workload report?
A workload planning report typically includes...
Every person in your agency has a limit to how much they can realistically get done in a week.
A designer may handle 25 billable hours per week excluding meetings and admin tasks, while a copywriter could manage 4–5 campaigns in the same timeframe.
A workload report captures this capacity so you don’t overbook anyone.
Next, the report lists what’s currently being done: active projects, tasks and deliverables, along with their due dates and the estimated hours required.
For example...
When you line this up against your team’s capacity, you see right away whether you’re balanced or overcommitted.
Billable (client) work earns revenue. Non-billable work (internal meetings, admin, training) doesn't.
Both matter but too much non-billable time reduces profitability. Time is money, remember.
The best workload reports don’t just show the current state of play, they also include what’s coming in the pipeline. I mean new projects, pending approvals and likely client requests.
This insight gives you foresight. You can see, at a glance, if next month is shaping up to be overloaded, although this week looks fine.
If you're Doubting Thomas, you'd probably wonder if you really need this level of detail.
So let me ask you...
At your agency, how do you currently handle client projects with changing requirements, uneven workloads and strict deadlines? Do you just spread them out evenly (or even worse, blindly) across your team?

You see, spraying and praying won't work here. Without a clear utilization report, you'll likely end up with...
Okay let's say you run a small design agency with five team members.
And you have two big projects to execute...
When you put this into a workload report, you'll notice…
This clarity lets you make smart choices…
You bring in a freelance designer for 20 hours or you stagger deadlines with the clients. Either way, you’re making the decision with full visibility, not flying blindly into disaster.
Do you now see why workload reports matter so much for agencies compared to other businesses?
There are a few other things to also consider…
As an agency, you rarely run one project at a time. There are always multiple clients (with competing deadlines) breathing down your neck at the same time.
You can’t just swap a copywriter for a designer if one is overloaded.
If your team is overworked, projects drag out and eat into profits. If they’re underused, you’ll be paying salaries without enough revenue to match.
Clients expect deadlines to be met. Missing a deadline doesn’t just create stress, it damages trust. I'm sure you'd want clients renewing contracts and referring others to your agency.
Workload reports let you see potential delays before they happen. If one designer is overloaded while another has free time, you can rebalance the work. And if a project is gulping more hours than expected, you can flag it early to the client.
Burn out your team members and watch your agency turn into a ghost town.
Not only will quality drop, you'll lose your best hands.
Uneven workloads are one of the biggest causes of burnout. You can't afford to have a team where some members crumble under deadlines while others stay underused, unmotivated and unhappy. With a workload report, you'll spot this imbalance long before doomsday.
One of the hardest calls you'll make as an agency owner is knowing when to bring in an extra hand. Hire too soon and you incur unnecessary costs. Hire too late and delivery time tanks as your team teeters on the brink.
My point?
A robust workload report helps you avoid these, balance the team and make decisions based on hard data.
Now how do you go about tracking agency capacity using a workload report? Let's discuss that next.
.avif)
Let me show you how you can track agency capacity using the good ol’ spreadsheet. Bear in mind that unlike automated dashboards (which we'll discuss a bit later), a spreadsheet won’t update automatically neither will it give you the live visibility you need to make on-the-spot decisions. But everybody starts somewhere, right?
Start with a simple table. Each row should be a team member. Add a column for their weekly available hours (excluding meetings, breaks and admin duties).
For example…
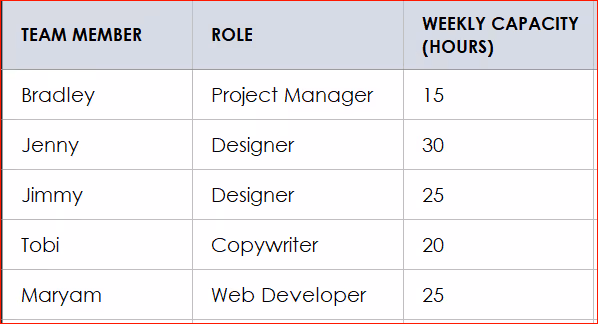
This gives you the baseline. I mean how much time each person can actually spend on client work.
Next, list all the projects currently in progress. For each project, break it down into tasks that will require time from your team. Include the estimated hours for each task and the deadline.
For instance…
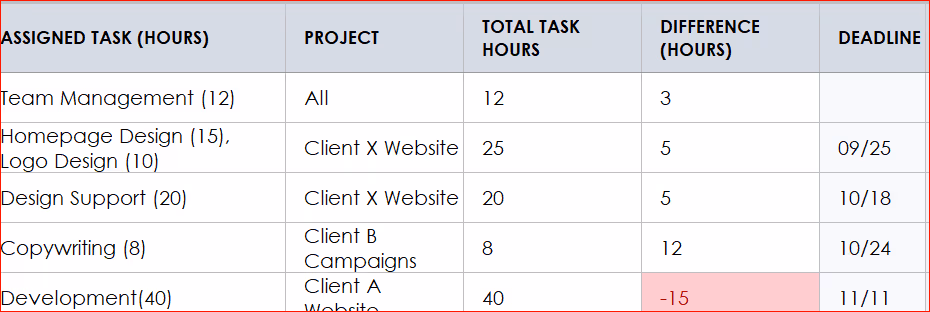
Assign each task to a team member. Add up how many hours of work each person has been assigned. Then compare it to their weekly capacity.
Something like this…
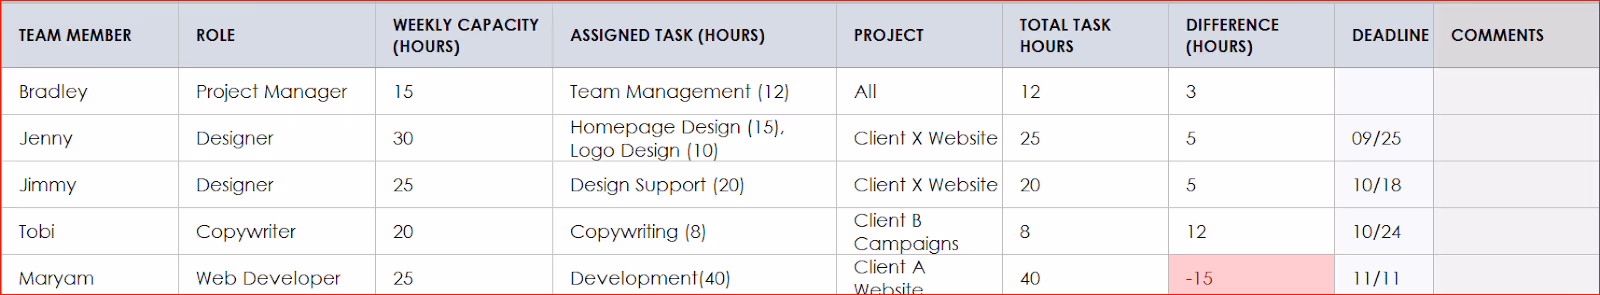
What do you see? At a glance, you can see that Maryam is overloaded while Tobi has plenty of free time. Without this report, you would have probably noticed the imbalance only after things have begun getting out of hand.
Once you’ve entered the data, use simple formatting to make risks stand out. You can…
The report is only useful if you act on it. So if someone is overloaded, ask…
This is where this spreadsheet morphs into a decision-making tool.
A manual workload report is only accurate if you update it regularly, at least once a week. So…
Do you see how important it is to track capacity?
Just imagine your team gets an unexpected urgent landing page design request (due in three days) in mid-month.
Without a workload report, you’d probably panic and assign it to whoever seems free at the moment. Armed with it, you'll calmly look at the numbers. And as they say, numbers don't lie…
How would you handle this situation? Well, in your position, I'd …
That said, do you notice the cons that come with using spreadsheets to track capacity?
So here's my 2 cents…
Once your agency starts juggling a few projects, start looking at automated dashboards.
You know what? Let's talk about that now.

If you’ve managed more than a handful of projects on a spreadsheet, you may have already seen the light: spreadsheets aren't fit for creative work with so many moving pieces happening at the speed of light.
Every new project or scope change means going back into the sheet, updating tasks, hours and deadlines. It can take significant hours each week just to keep the data current.
A workload report you updated on yesterday can be wrong by two days later as clients send new requests or deadlines shift.
Supposing your agency handles six clients at once, relying on spreadsheets. You'd be updating hours, tasks and deadlines across multiple tabs every few days. And by the time you finish, half the data is already outdated.
All it'll take is one wrong formula, one missed update or one task logged in the wrong row to screw up your entire view of team capacity.
Spreadsheets don’t connect to the rest of your workflow. You can’t instantly see how client requests or project changes impact the whole team.
Here's the thing…
As an agency owner or ops manager, would you rather spend the bulk of your time updating spreadsheets or actually working on your business?
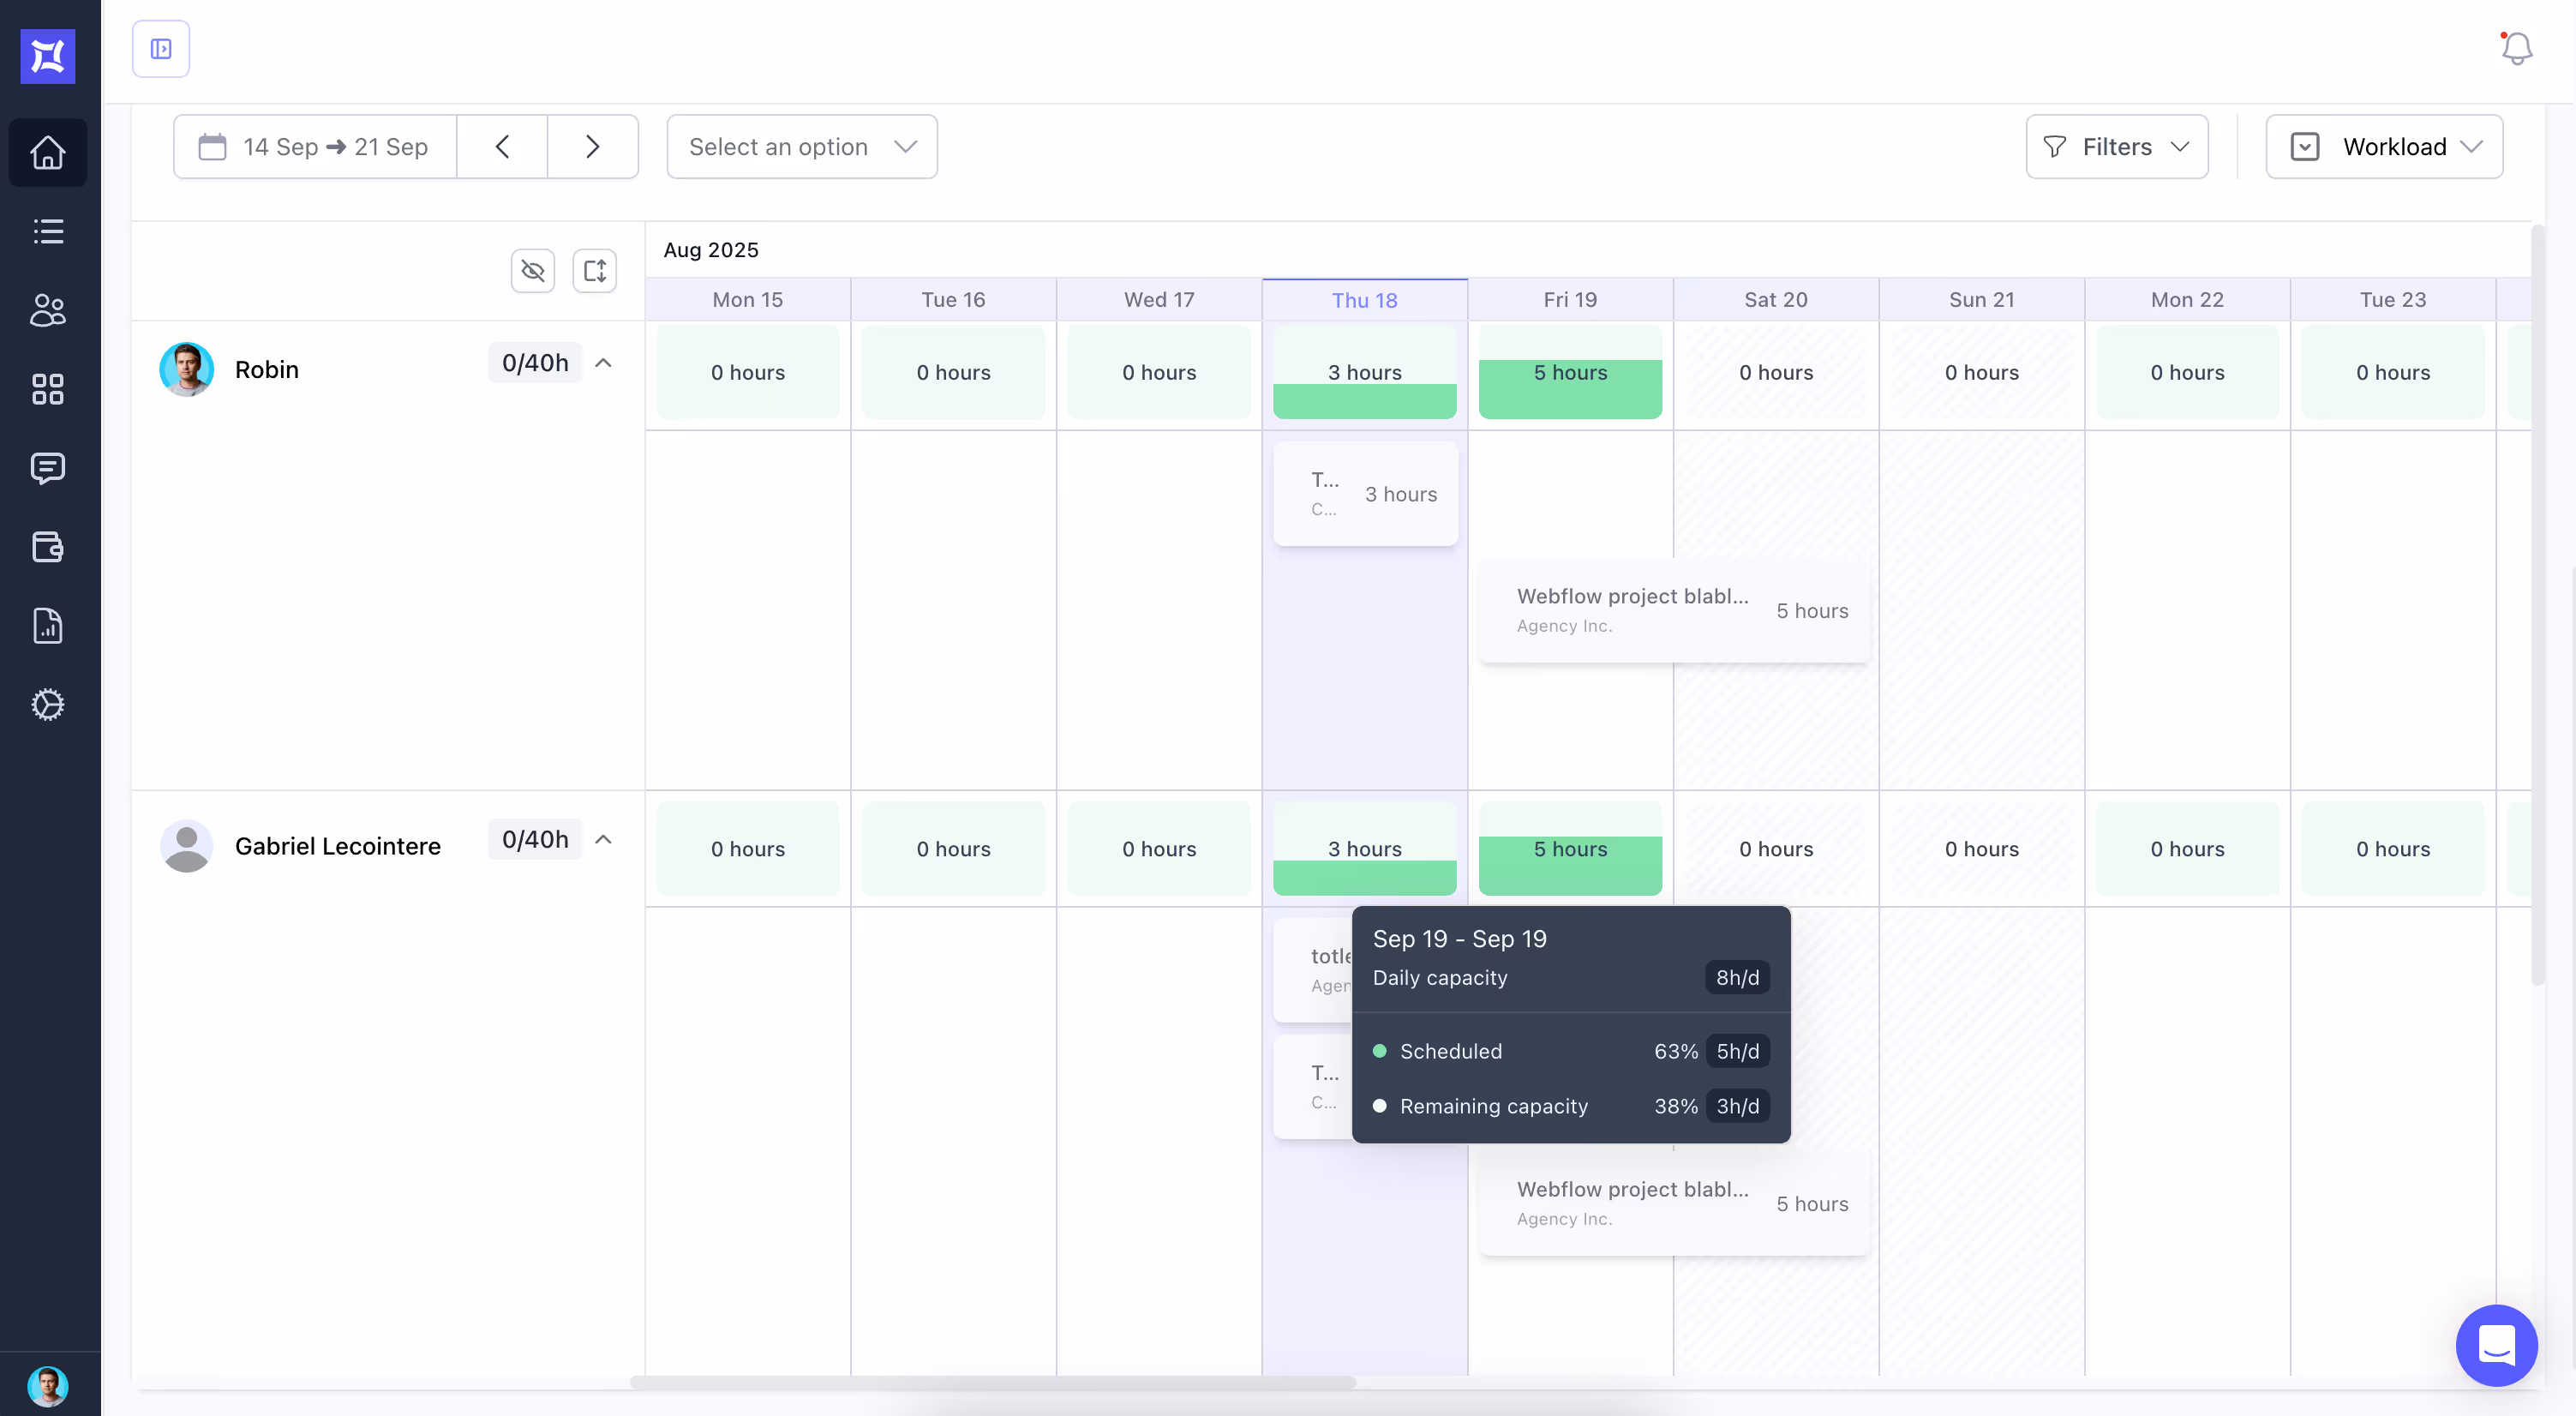
Automated dashboards solve these problems by giving you a live, connected view of your team’s workload.
Instead of manually entering data, the system updates automatically as work comes in. Instead of static rows and columns, you get a clear visual of who’s at capacity, who has room and which projects are on track.
When a client submits a new request, it instantly reflects in the dashboard. No manual copy-pasting needed.
Automated dashboards offer clear charts and bars. That way, you can see overload or free time at a glance.
You get to see not only today’s capacity, but also the weeks ahead. With this, you can see the bumps ahead and come up with adequate solutions.
Everyone (not just you or the manager) can see what’s on their menu.
I know what you're thinking. “Good and fine, but how does this actually help my business?“
Let's see…
Need to know if you can take on a new client by next month? The dashboard supplies the answer in seconds.
You can spot bottlenecks from a mile away and rebalance tasks accordingly to meet deadlines.
Identify workload imbalances before they turn into burnout. The last thing you need is a burnt-out team low on morale.
Keep your eyes on those hours so you don’t overservice without noticing.
The good news is that you can do all of this inside ManyRequests…
You can see each team member’s capacity and assignments in real time.
Track progress across multiple clients without flipping between files and tabs.
When clients send requests, they flow straight into the portal and the dashboard. No manual entry required. With an automated dashboard, the moment a client submits a new request, it appears in the system. So you can instantly see how it affects capacity.
Get a clear picture of not just today’s workload, but what’s coming next week or next month.
With automation, you can do everything you used to do on spreadsheets and more, but this time, faster, clearer and always up to date.
In a nutshell automated dashboards help you save time, reduce errors and make smarter decisions faster. This means more money saved in time and made in profits.
A workload report is a document or dashboard that shows how much work each person on your team is handling.
It lists projects, tasks and deadlines, then maps them against the hours each team member has available. Agencies use it to see who is busy, who has capacity and where issues may appear.
Team capacity is measured by looking at available work hours versus planned tasks. Start with how many hours each person can realistically work in a week (besides meetings, admin or time off).
Add up the estimated hours for their assigned tasks. Compare the two. If tasks are higher than available hours, that person is overloaded. If hours are lower, they have bandwidth.
List all active projects and tasks.
You can start with a spreadsheet, but as your agency grows, automated dashboards such as ManyRequests’ will help you save time and reduce errors.
Thank you for reading to the end. You're indeed, the real deal.
Rounding it off now, team capacity tracking is essential for agencies. Creating solid workload reports can be the difference between your agency staying afloat or going under. This is because it impacts several other things.
Now, if you currently handle just a few projects, you can start off with our free agency workload template here.
.avif)
But if your operations have outgrown spreadsheets, requiring time-saving automated dashboards that update in real time, track billable vs. non-billable hours, and give you clear answers, ManyRequests has you covered too. Get a free trial here to get started.
Thank you once again and see you on the next one.
1. See how ManyRequests works in real life. Start a free trial and experience how productized agencies centralize requests, reduce chaos, and streamline delivery, without changing their entire workflow.
2. Read our Implementation Guide to launch smoothly with your team and clients.
3. Follow us on LinkedIn and YouTube for practical agency growth strategies
4. Check out The Productize Blueprint to learn how to turn your services into a scalable, productized offer.
William Nzewi is a data scientist and a writer. He likes to read and learn new things, especially about tech, business and life.