Mastering KPI Reports for Creative Teams in 2026
Master KPI reports in your agency. Track client results, team output, and profitability without spreadsheets.

Adetola Rachael Iyanuoluwa

There's a difference between running your agency and growing it. The difference is in how you try to meet all clients’ goals, keep them happy, and maintain a reasonable profit margin.
If you lead a creative agency, there's a good chance you've unsuccessfully tried to prove your team's impact. Your team satisfies every client, and you get referrals (and actually onboard new clients) thanks to that.
But it's still difficult to know if your agency is growing, if your services have enough profit margin to run the show and pay yourself, and if there are projects you waste more time than necessary on.
In this guide, I'll explain how to track these metrics with the right indicators.
You'll learn:
Key Performance Indicators (KPIs) are quantifiable values that agencies can use to track the progress of their business goals.
For example, if you wonder how many percent of total clients your agency retains every year, you can track a KPI like client retention rate. Just to know if you keep clients happy enough to stay with your agency.
KPIs bring you back to the drawing board to know what's working, what's not, and how to make them work.
Now, what are KPI reports?
KPI reports are structured documents that track your agency’s KPIs over a time period (weekly, quarterly, or monthly performance reports). Unlike general reports that summarize your activities, KPI reports zoom in on what drives outcomes, like client results, team performance, and project efficiency.
There’s a lot of metrics to track. However, blindly tracking every indicator can set you off your trail. A good KPI focuses on what’s predictive, actionable, and aligned with your goals, some of which are:
These measure how well you deliver value from the client's perspective. Some of them include:
Measures how satisfied your clients are with your service, or after an interaction with your team.
You can get this score by asking clients to rate your work on a short feedback form, usually on a scale of 1-5 or 1-10.
You can ask "How satisfied are you with the service you received?" The higher the score, the more likely you are to retain clients.
NPS assesses client loyalty level by asking how likely they are to recommend your agency to others on a scale of 1-10.
Clients that rate with 0-6 are called Detractors (unhappy clients), 7 - 8 are Passives (satisfied but unenthusiastic clients), and 9-10 are Promoters (loyal enthusiasts that would use your service again and refer to people who need your service).
If your NPS is below 7, you're at high risk of churn, because clients that won't refer will most likely not purchase your services again.
Measures how many clients renewed or rebooked over the last quarter.
CRR= (Customers at end of period − New customers during period/Customers at start of period )×100
For example, if you start with 100 clients, gain 10 new clients, and end with 95 clients, your retention rate is 95-10/100 = 85%.
Measures how quickly your team responds to client emails, requests, or approvals after they reach out.
You can calculate it by dividing the time it takes to respond to all client inquiries by the numbers of inquiries during that period.
For example, if four client requests took 10, 15, 25, and 20 minutes to respond to, the average response time would be (10+15+25+20)/4 = 17.5 minutes. Long delays damage trust, and it's easy for emails to get lost in the crowd when you talk to many clients.
With ManyRequests, you can centralize all client communication in one dedicated portal instead of scattered email threads, so requests never get lost in crowded inboxes. You can also track your response rate:
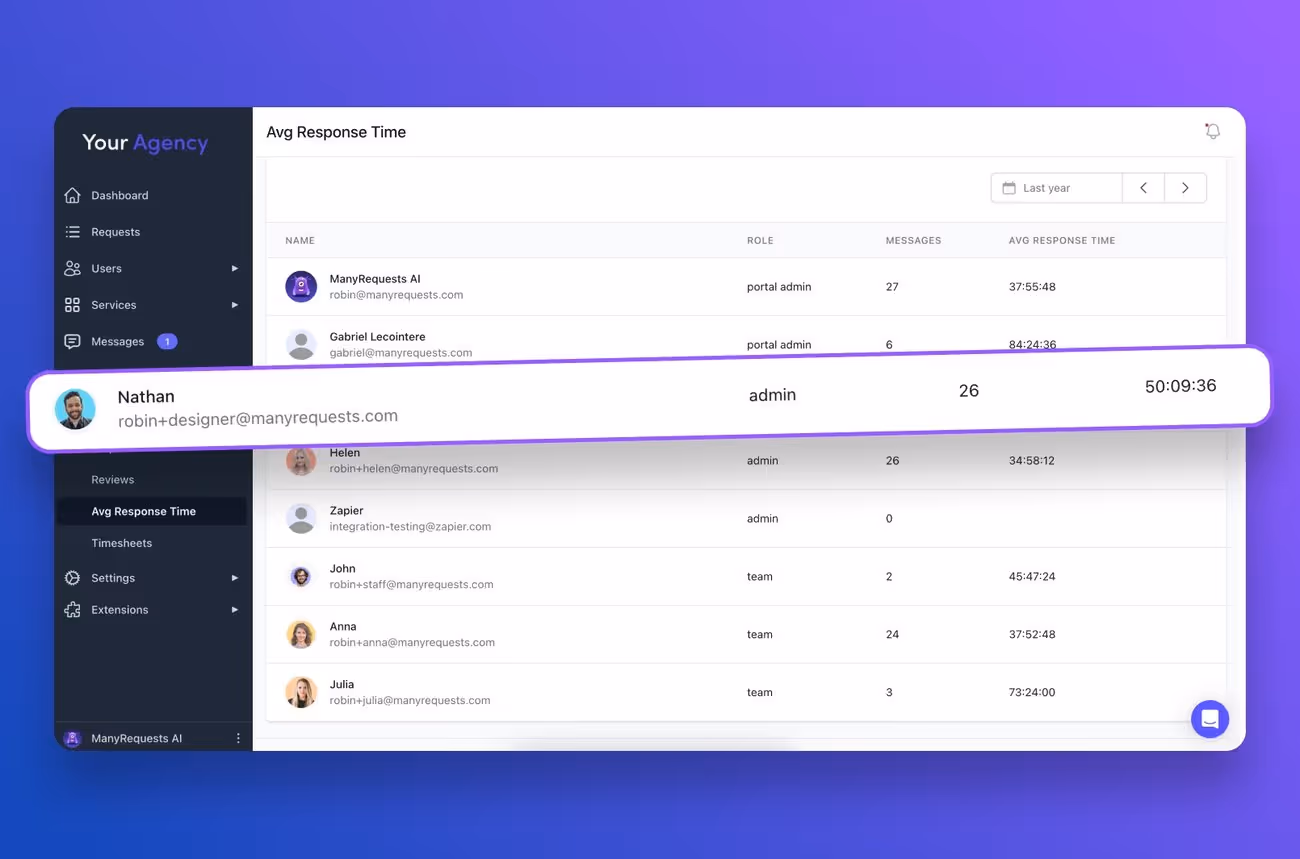
The platform also sends real-time notifications for new messages and requests, making sure your team sees client messages and can respond immediately.
These project management KPIs measure how you deliver to clients.
Measure the percentage of projects that hit the agreed deadline.
Formula:
(Number of projects delivered on or before the agreed deadline / Total number of projects delivered)×100
For example, if you completed 100 projects last quarter and 85 were delivered on time, your on-time delivery rate is: 85/100 × 100 = 85%. If this drops below 80%, you likely have a scope, resourcing, or approval problem.
Are you averaging 2–3 rounds or more like 5–6? More than 3 may suggest unclear briefs, poor internal QA, or misaligned expectations.
How many deliverables per designer (per week or month)? Use this to benchmark productivity without micromanaging.
Measures how quickly your team moves from project initiation to producing tangible outputs. If your team completed three projects in 5, 7, and 6 days respectively, the average time would be 5+6+7/3= 6 days.
These metrics measure your agency's financial health and profitability.
Measures the percentage of time spent on client-paid work vs admin or internal tasks. If you record under 70%, you’re bleeding time (and profit).
Measures revenue minus all associated costs (including hours worked). Some projects feel great, but lose money on review rounds and resourcing.
Helps you spot which clients generate the most value—and which ones take too much effort for too little return.
If you’re forecasting upcoming projects, tracking this monthly helps balance team capacity and new business needs.
Read more: The 13 KPIs To Master for Creative & Marketing Agencies
Here's how to build KPI reports that actually drive agency decisions:
Start with the basics first. You can't track what you don't measure.
For Client KPIs:
You can trigger it after you mark a project as complete, so clients have to write about their experience working on the project with your team. It looks like this:
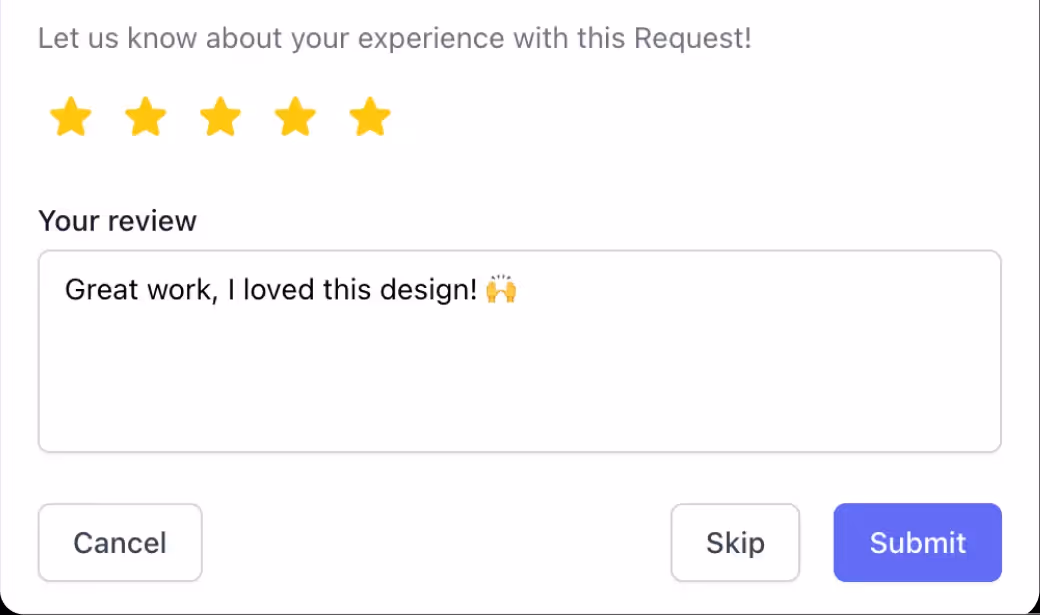
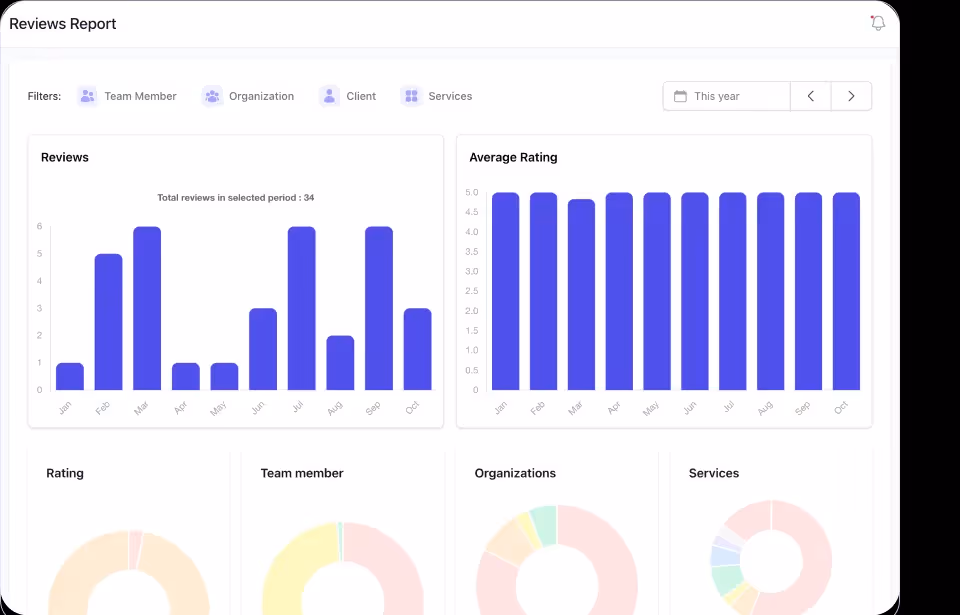
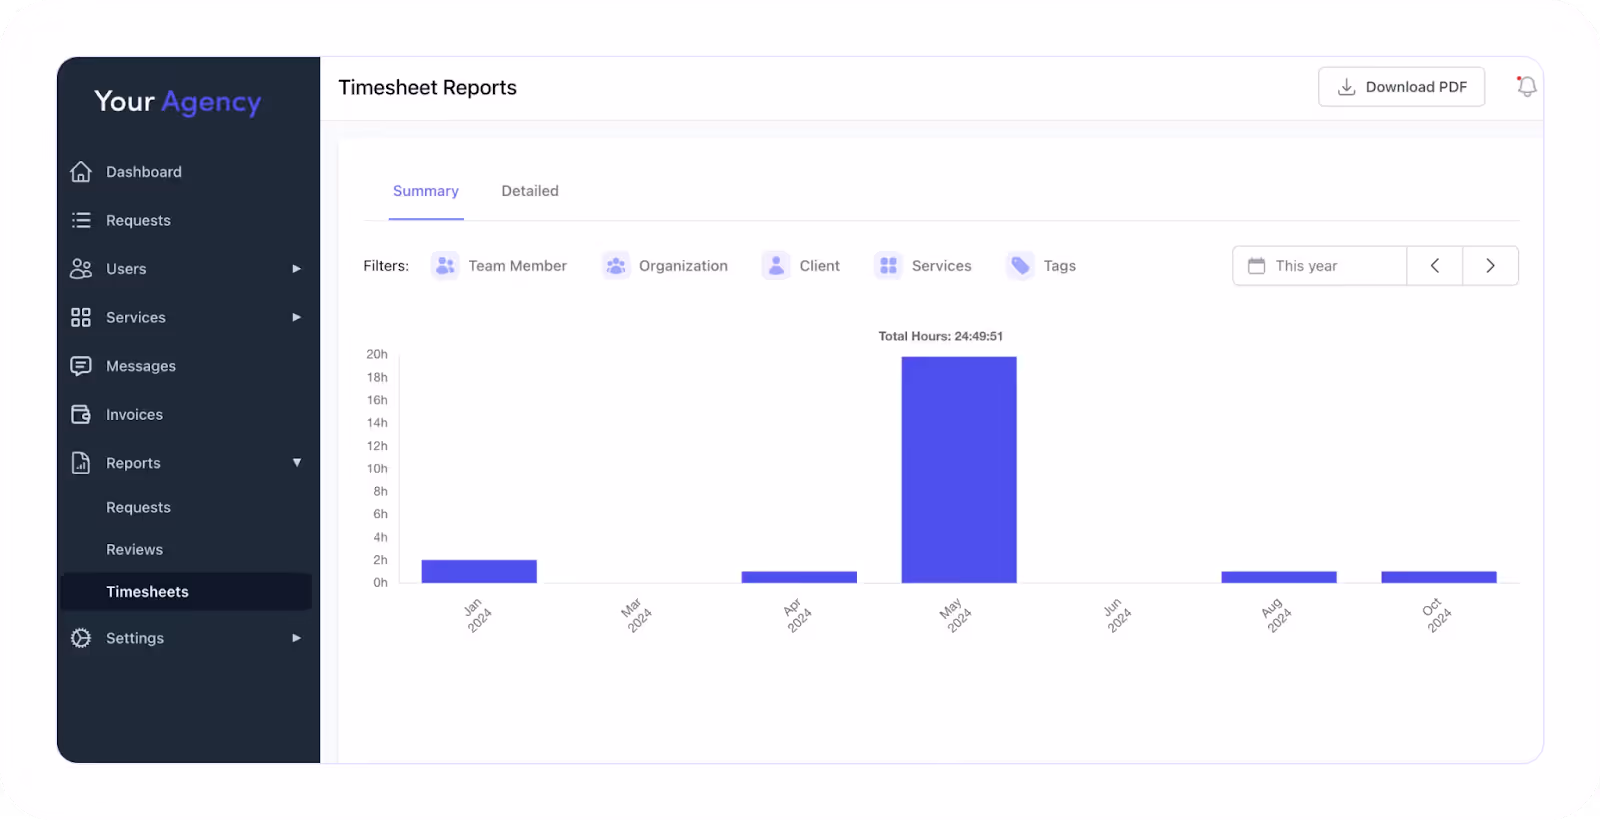
ManyRequests automatically tracks time logged against each request or task so your billable and non-billable time are up to date. You can also handle feedback requests and CSAT surveys from its client portal. When clients score you, it shows directly in your dashboard.
For Project KPIs:
However, you can also automate this via ManyRequests. Through your requests dashboard, you can see the total number of projects you have, when they were assigned, and when they were completed:

This way, you get a single view for your projects and can track all deadlines easily.
For Financial KPIs:
Monthly performance reports work best for most agencies. Weekly may make your team feel like you're micromanaging them, and you may miss problems too late if you make it quarterly.
Once you decide, create two report types:
You can section your dashboard layout to show:
Your data collection process should be simple and organized. Here's a simple template:
Pro tip: Assign one person to own this process. When everyone's responsible, no one is.
Start with these essential sections:
Executive Summary (2-3 sentences)
Client Health Metrics
Project Performance
Financial Performance
Track the numbers and make sure you understand what they mean. Use the red-amber-green method to know what's below the line and what's flourishing. For instance:
Green flags mean you're doing well. This could be your agency's:
Amber flags tell you to pay attention. This is when:
Red flags show that you need to fix the problems immediately. For example:
Create a clear plan for each KPI result that's below average.
ManyRequests is an all-in-one client portal and project management tool that puts your team, clients, and tasks in one platform without one stepping on the other.
The system uses a dashboard that tracks all tas ks, assignees, priority levels and deadlines. There's also a client portal where your team can discuss with clients directly, and clients can interact with their project at all times.
Share reports with your whole team, not just leadership. Everyone should understand how their work connects to agency success.
To do this:
The goal is to make better decisions, not generate perfect data. Start simple, stay consistent, and adjust as you learn what matters most for your specific agency.
These are some tools that simplify how you create KPI reports:

ManyRequests is a client portal, time tracking, task management, analytics, and reporting tool—all in one.

It tracks the time your team spends on a project automatically and allows you to send satisfaction scores in-app to track client satisfaction, among many others.
Sign up for a 14-day free trial (no credit card needed) to see how it works.
These platforms offer plug-and-play dashboards customized for agencies, with templates for marketing, SEO, and more. If you already use tools like CRMs or SEO platforms, these tools centralized the signals in one dashboard.
If you use ManyRequests or other tools (like Trello or Airtable), Zapier can help sync your data automatically into Google Sheets, which you can then surface via Looker Studio.
KPI reports keep creative agency on the right track, but it's important that the KPIs you measure matters to your agency growth.
The agencies that track the right metrics know their client satisfaction scores, meet deadlines, and know which projects drain their resources more than others. And when these indicators are off, KPI reports show them what's wrong, to improve it early.
ManyRequests makes tracking most of these KPIs automatic. You can track your client satisfaction scores, response times, project deadlines, and billable hours in one platform without switching between tools. Sign up for a 14-day free trial (no credit card needed) to see how it works.
Originally Published: May 20, 2021
1. See how ManyRequests works in real life. Start a free trial and experience how productized agencies centralize requests, reduce chaos, and streamline delivery, without changing their entire workflow.
2. Read our Implementation Guide to launch smoothly with your team and clients.
3. Follow us on LinkedIn and YouTube for practical agency growth strategies
4. Check out The Productize Blueprint to learn how to turn your services into a scalable, productized offer.
Adetola Rachael Iyanuoluwa is a B2B SaaS writer and content marketer with 4+ years of experience creating SEO, human-focused content. She writes in-depth how-to guides and comparison articles content that help SaaS companies grow organic traffic and turn readers into customers. At ManyRequests, she produces practical, well-researched content that helps agencies and service businesses streamline operations and scale sustainably.